
A Lesson in Early-Stage Proforma Discipline.
We’d sketched the land plan, rough-coded the uses, and mapped out road alignments on topography. The site had promise: over 500 acres with strong environmental features and a rich historic context, all just minutes from a state capital. It had the kind of bones that typically make a great place.
The ownership group was looking for a partner and had approached us at Celebration Associates to get involved. We liked the vision. But even with a compelling narrative, the early math didn’t line up.
We ran the back-of-the-envelope numbers: land cost, site infrastructure, and long absorption timeline. When we looked at the early yields and returns, they didn’t meet the risk thresholds we require for a land-based, master-planned project.
That quick analysis is what saved us. It gave us the clarity to say no, or at least not yet.
This initial financial analysis is precisely what early-stage proformas are for. Not to validate what you hope is true. But to check if the concept stands a chance. To see whether the risk aligns with the potential reward. And if not, what needs to change before you burn time and capital chasing something that’s not viable.
Why Start with a Back-of-the-Envelope Proforma?
At the Strategic Definition stage, you’re still working in big strokes. You might have a vision, a rough master plan, and some early enthusiasm. What you likely don’t have is certainty.
Before diving into design, entitlements, or hiring consultants, you need to answer a simple question:
Can this concept work financially under reasonable assumptions?
The early-stage proforma is fast, incomplete, and sometimes ugly. But it gives you just enough signal to move forward with intent—or hit pause and rethink.
For us, the litmus test begins with a few key metrics. In a stable market, our financial partners and internal criteria generally expect the following:
- A gross margin on land sales of at least 30%.
- A leveraged internal rate of return (IRR) of 25% — and in some cases, more. Recent conversations with investors suggest 25% to 27% targets.
- A doubling of invested capital over the hold period.
- A development timeframe of 5 to 7 years from initial capital deployment to exit.
If a back-of-the-envelope analysis shows that a project can’t realistically meet these thresholds, it’s a signal. Either the structure needs to change, or the project may not be a fit.
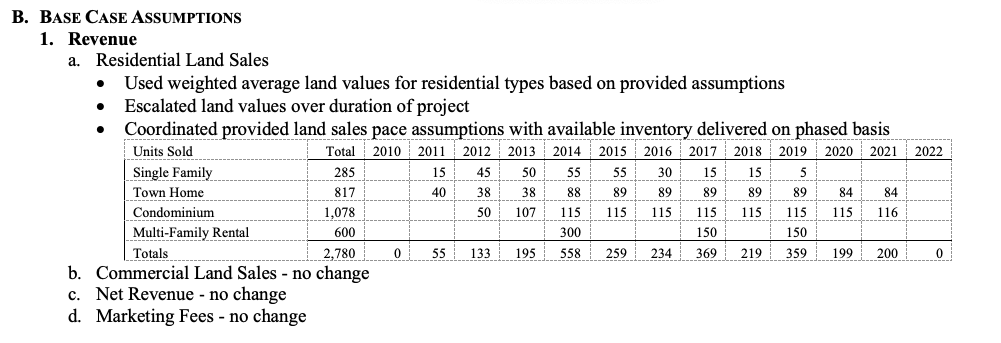
Breaking Down the Project’s Revenue Potential
When we looked at the project’s land plan, we made a rough breakdown of expected land uses: neighborhood-scale single-family, rural estate parcels, a modest civic node, and a large portion of preserved open space. From there, we estimated unit counts, average pricing based on comps, and lot sales value using standard rules of thumb.
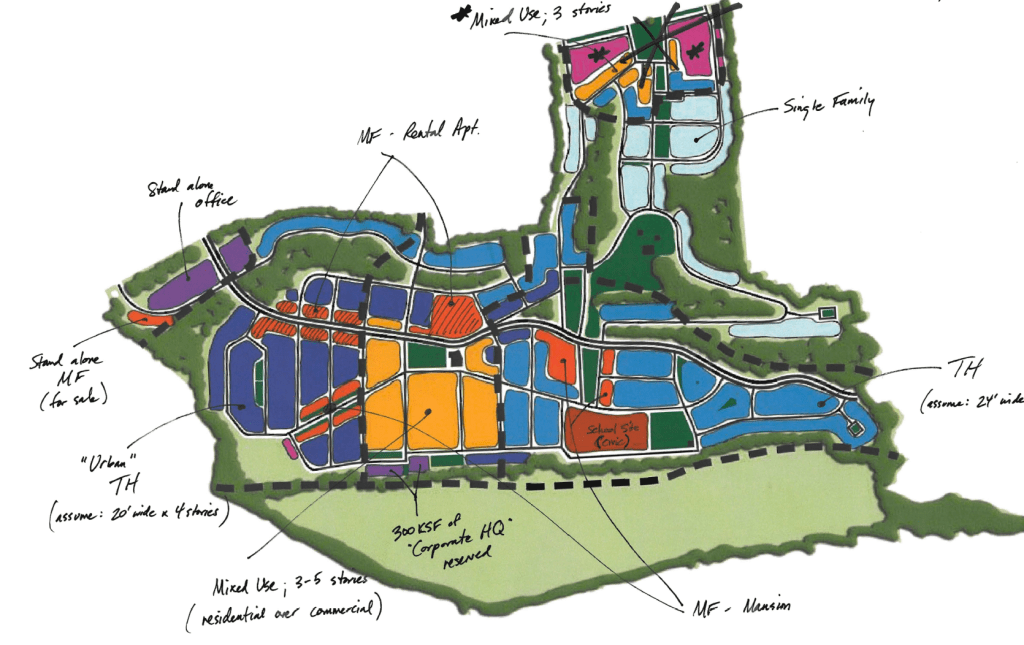
For example, a lot supporting a $600,000 home would typically be worth around $120,000 to $150,000, assuming a finished lot represents 20–25% of the total home value. That ratio works in many suburban and edge-of-market locations. Once we plugged in the estimated lot counts and land values, we had a total revenue range. It was directional but grounded enough to start pressure-testing.
We also considered the market segmentation: traditional lots targeting mid-range buyers, estate lots for higher-end purchasers, and civic or amenity parcels treated as non-revenue generating but essential for overall absorption and community positioning.
Estimating the Development Costs
Next came the cost model, which included all the typical categories: horizontal infrastructure (clearing, grading, stormwater, utilities, roadways), off-site improvements (signalization, road upgrades, utility extensions), and vertical elements like community buildings and landscape enhancements. We folded in soft costs, including design, legal, engineering, impact fees, and a contingency line item that typically ran 15-20%.
Our per-lot infrastructure estimates were benchmarked against similar communities we’d worked on. Even modest shifts in per-unit cost assumptions—say from $65,000 to $75,000—could significantly swing the proforma at this scale. That’s why we always assume conservatively and verify with past project data.
We also paid close attention to early-phase infrastructure exposure. Some sites require heavy upfront spending on access, utilities, or grading just to get to the project’s initial phases, which is a red flag in a fragile financial model.
Include Indirect Expenses
It’s important not to overlook internal staffing and overhead expenses required to run the development. These include salaries or fees for project management, development leads, administrative support, accounting, and any shared services tied to running the business side of the project. While some indirect costs may already be partially allocated under soft costs, it’s good practice to model an annual allowance based on actual staffing needs or apply a general percentage of total development costs (typically 3% to 5%) to reflect this load.
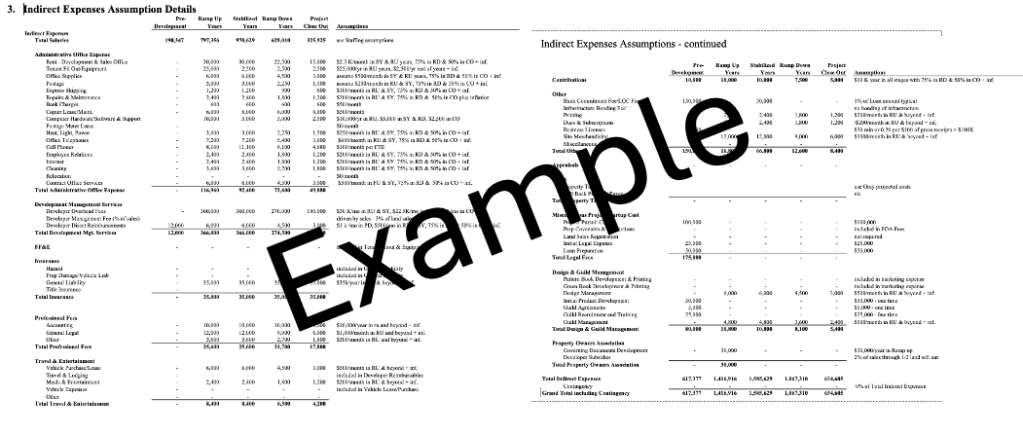
Whether embedded within soft costs or tracked separately, these internal resources are real costs, especially over a multi-year development timeline. Accounting for them early adds credibility to the financial model and prevents future budget compression or under-resourced delivery teams.
Account for Sales and Marketing Costs
Include costs related to marketing and selling the property. At this stage, the most straightforward approach is to apply a percentage of the total gross sales revenue (based on the fully developed home and lot package).
For sales transaction fees, use standard brokerage or closing fee percentages commonly found in the local market — typically between 5% and 6% of gross sales value for residential properties.
Marketing costs can vary widely. Projects in or near strong metro markets may range from 3% to 5% of total sales. For more remote, resort, or second-home communities, marketing costs can be substantially higher due to the need for destination branding, extended campaign durations, PR, special events, and more targeted buyer engagement. Adjust this assumption based on location and project type, but ensure it’s in the model from the start.
Considering Operational Carry
Long development timelines bring their own drag—operational carry. Even when phased well, there’s often a multi-year period during which the developer is fronting HOA operating deficits, maintaining parks and trails, carrying taxes on undeveloped land, and funding marketing or admin support.
In our experience, this adds between $1M and $2M in direct out-of-pocket costs over a 5-7 year span, depending on scale and handoff timing. Too many early models omit this, but it directly impacts equity yield and loan coverage.
We always build it in.
Setting the Financing Assumptions
We assumed a standard 70/30 debt-to-equity structure, with construction financing covering horizontal infrastructure and internal equity funding for land, entitlements, and soft costs.
At 6.5% interest-only, our carry costs were substantial. We modeled a draw schedule and layered a full interest reserve for the development term. But even with careful assumptions, the project struggled to hit the 1.2x debt service coverage ratio lenders often require by project stabilization.
We also ran basic return metrics — IRR and equity multiple. Both fell well short of our 25% IRR and 2.0x equity targets.
Pressure Testing the Model
We ran three scenarios: base, downside, and upside.
In the downside case, the project lost money. In the base case, it returned marginally positive outcomes, but not enough to warrant the risk. Only in the upside case did we start to flirt with a close to acceptable multiple and IRR.
But the upside shouldn’t be the justification for proceeding. The base case must meet or exceed minimum thresholds. Otherwise, your margin of error disappears.
This model didn’t clear the bar, which meant that the concept—or structure—had to change.
What the Proforma Told Us
It told us the plan had merit, but not in its current form. We had a site with potential, a strong location, and a partner ready to move.
However, the financial structure didn’t support the risk until some key items shifted, such as cost reductions, funding partnerships, or density adjustments.
That was valuable. It allowed us to pause, rethink, and avoid chasing a concept that didn’t align with our investment thresholds.
And that’s the purpose of a good early proforma.
What Makes a Back-of-the-Envelope Model Effective?
It doesn’t need to be complex. It needs to be structured around the proposed land uses, anchored to real data, conservative on timing, and honest about risk.
It should include everything material: development costs, contingency, operational carry, financing assumptions, and key return metrics — IRR, equity multiple, and debt service coverage.
And above all, the team should use this information to make decisions, not just support them.
Step-by-Step: How to Build a Back-of-the-Envelope Proforma
For those looking to replicate the process, here’s a practical step-by-step guide to structuring an early-stage financial analysis for a land-based development project:
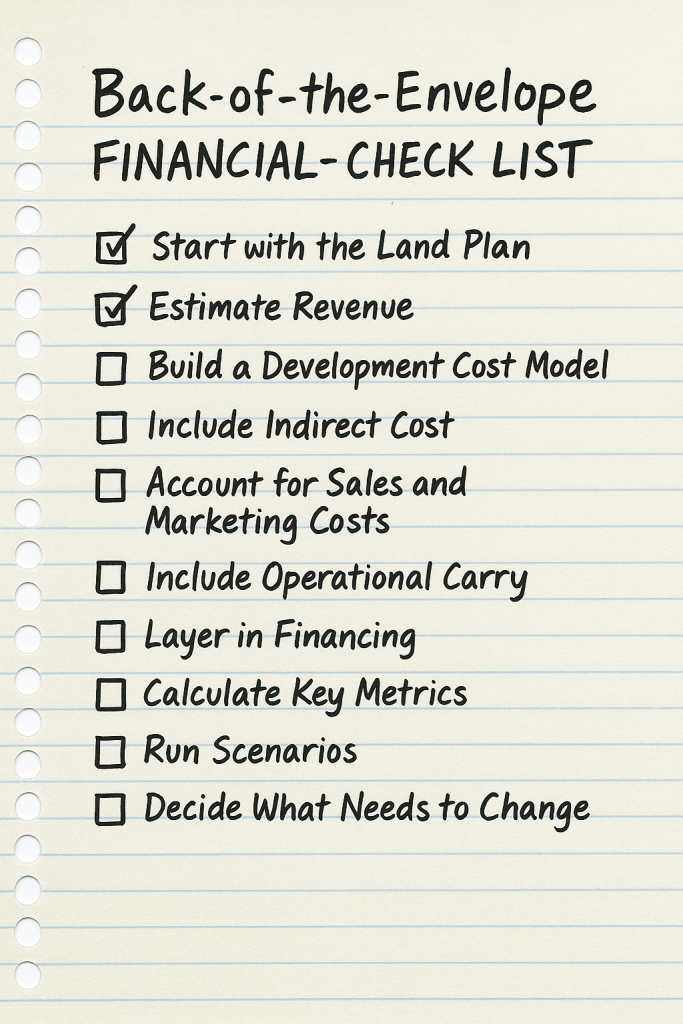
- Start with the Land Plan: Lay out a rough site yield based on the land use analysis and development program. Estimate total units, square footage, or acreage for each use type—residential, commercial, civic, open space. Your previously completed Site Due Diligence and High-Level Development Program come into play here.
- Estimate Sales Revenue: Assign pricing based on comps and market research. Use rules of thumb to price finished lots (typically 20–25% of anticipated home value), retail/office space per square foot, and any other revenue sources. Always include a vacancy or absorption cushion.
- Build a Development Cost Model: Estimate hard and soft costs: infrastructure, site work, amenities, legal, design, impact fees. Apply reasonable per-unit or per-acre assumptions and include contingencies—typically 15–20%.
- Include Indirect Cost: Account for the Indirect costs needed to manage the project. Indirect costs include staffing for project management, entitlement coordination, design oversight, marketing administration, and general development operations. While some of these costs may be captured under soft costs, including a development overhead allowance, it is good practice.
- Account for Sales and Marketing Costs: Include costs related to marketing and selling the property. At this stage, the most straightforward approach is to apply a percentage of the total gross sales revenue (based on the fully developed home and lot package).
- Include Operational Carry: Account for interim costs during the development period: HOA subsidies, common area maintenance, taxes, and insurance. Estimate this on a per-unit or annual basis.
- Layer in Financing: Assume a debt/equity structure (e.g., 70/30). Apply an interest rate (e.g., 6.5%), include a draw schedule, and estimate an interest reserve. Validate against typical DSCR thresholds.
- Calculate Key Metrics: Calculate IRR, equity multiple, debt service coverage, and gross margin on land sales from your revenue and cost estimates. Compare these against your financial benchmarks.
- Run Scenarios: Model a base case, downside, and upside. Adjust revenue, costs, and timing assumptions to understand sensitivity and risk exposure. A viable project should meet targets even in the base case.
- Decide What Needs to Change: If the numbers don’t work, ask what variables can be adjusted. Density? Phasing? Cost sharing? Public investment? Let the proforma guide your next steps.
Done right, this early-stage model becomes a strategic tool, not a financial hurdle. It frames decisions, flags red zones, and highlights where refinement is needed before real capital is deployed.
Final Thought
A back-of-the-envelope proforma is like a quick soil test. You’re not designing the foundations—you’re just checking whether you’re standing on bedrock or quicksand.
In this case, the numbers told us what we didn’t want to hear. As exciting as the project was—and as aligned as it seemed with our values—it just didn’t work out. That’s where clear-headed analysis matters. We hit pause, looked hard at the facts, and ultimately made the call to walk away.
Not every good idea makes a good investment. That’s why you run the numbers early.

Leave a comment